Share on Facebook
 Share on X
 Share by Email
 Share on Google Classroom
Canadians participate in the political system any time they voluntarily try to influence the outcome of an election, or a government or party policy. This can be done in various ways, from voting to campaigning for a political cause to running for political office. The highest turnout rate for a federal election was 79.4 per cent in 1958. Voter turnout in Canada declined in the 1990s and 2000s, reaching 58.8 per cent in 2008. The numbers then began trending upwards, reaching 68.3 per cent in 2015 and 67 per cent in 2019. Women, who gained the right to vote federally in 1918, vote at slightly higher rates than men. Older citizens are more politically active than younger ones, although voting among people age 18 to 34 increased sharply between 2011 and 2019.

Ways of Participating
Political participation may be as simple as casting a ballot; or going further and being a candidate for political office. Political action could be trying to change the broad outlines of public policy; or it could be very specific (e.g., seeking personal benefit such as a patronage appointment). Political action could even be something illegal; for example, selling political connections for money. (See also Corruption; Conflict of Interest.)
Paying taxes is not normally considered a political act but refusing to do so can be. Going on strike over wages or working conditions is not strictly a form of political participation. Some strikes are more political than others, especially when they become protests about a particular policy or labour condition in society. (See also Labour Relations.)
Easy and Difficult Activities
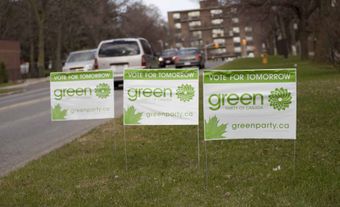
Participation depends on the ease or difficulty of the action. During election campaigns, about one in five Canadians try to persuade a friend to vote for a particular party or individual, according to Canadian Election Study surveys. But only about one in six attend a rally or meeting; or display a lawn sign or bumper sticker. Only about one in 20 Canadians canvass door-to-door; help to mail campaign literature; make campaign-related telephone calls; or act as election-day drivers or scrutineers for political parties. About the same percentage claim to have given money to a party or a candidate; or belong to a party. Fewer still run for office.
Costs and Benefits
One major consideration is the cost of political participation. Some political acts cost money and are most likely to be engaged in by those with money to spare. Other acts require free time. Many political acts require social and bureaucratic skills, a mastery of language and an ability to process information; they are therefore powerfully influenced by levels of education. Higher education levels, however, do not always result in greater participation. Whatever their education level, older citizens are more politically active than younger ones. Skills developed through non-political experiences (e.g., in the bureaucracy; in churches or voluntary associations) are often useful to political participation.
Women only received the vote in national elections in 1918. They were therefore traditionally less politically active than men. (See also Right to Vote in Canada.) However, women now vote at slightly higher rates than men. Demographic trends suggest the same will become true among women for other political activities as well.
The benefits of political activity also influence participation. People are more likely to vote and engage in campaign activities when a race is close than when it is one-sided. Some occupation groups are more affected by government decisions than others; they are more likely to act politically. Public Service employees, whose incomes depend on political decisions, vote at a higher rate than other citizens. Farmers’ incomes are affected by government price and supply management decisions; they are more active than other groups with similar income and education levels.
Some political actions generate social benefits for individuals. Canvassing and committee-room work are popular among those who enjoy the company of others. Donating money requires few social skills. Displaying a lawn sign or bumper sticker requires neither money nor highly developed social skills; but it does require sufficient commitment to a party or a candidate. Surveys suggests that people are more likely to engage in the same action in both provincial and federal elections, than to engage in more than one action within either type of election.
Voting Rates
How often people take part in political activities depends on the type of activity and where they live in Canada. According to Canadian Election Study surveys, about 90 per cent of Canadians eligible to vote have done so at least once.
Prince Edward Island tends to have the highest turnout rates in the country, in both provincial and federal elections; it had a peak of 86 per cent in the 2015 federal election and 82 per cent in 2019. The lowest turnout of any province tends to be in Alberta (52 per cent in 2011). Turnout is often even lower in the territories (39 per cent in Nunavut in 2011).
Voter Turnout
Voter turnout in federal and provincial elections dropped sharply in the 1990s and early 2000s. This provoked concern about the impact on Canada’s democracy. The highest federal turnout after the Second World War was in the 1958 election; 79.4 per cent of eligible voters cast ballots. (See Elections of 1958 and 1959.) The rate then hovered in the 70s until 1997, when it fell to 67 per cent. It dropped to 64.1 per cent in 2000 and to 60.9 per cent in 2004, according to Elections Canada. The rate was 64.7 per cent in the 2006 election but then fell to 58.8 per cent in 2008, the lowest postwar level.
Turnout varies across age groups and is worse among young voters, a gap that has widened since the 1990s. Only 55 per cent of Canadians aged 18–24 voted in 2011, compared to 84 per cent aged 65–74. Turnout also tends to be lower among single parents and newer immigrants (who have obtained citizenship), according to Statistics Canada.
Turnout in provincial elections has followed a similar trend to national elections. For example, in British Columbia, turnout was 77.7 per cent in 1983 and 51 per cent in 2009. In Quebec, it was 85.3 per cent in 1976 and 57.4 per cent in 2008. In Nova Scotia it was 78.2 per cent in 1978 and 58 per cent in 2009.
However, the numbers in federal elections began trending upwards in the 2010s. Turnout was 61.1 per cent in 2011, 68.3 per cent in 2015 and 67 per cent in 2019. Somewhat surprisingly, the biggest gains in 2019 were among younger voters. According to Statistics Canada, voting among people age 18 to 24 increased from 55 per cent in 2011 to 68 per cent in 2019. Among people age 25 to 34, turnout increased from 59 per cent to 74 per cent. Over the same period, the biggest gains among the provinces were made in Alberta and Saskatchewan; turnout increased from 66 per cent to 80 per cent in the former and from 69 per cent to 81 per cent in the latter.
Some observers argue that current participation levels are sufficient. Most of those Canadians who do not vote also care or know little about politics, and often have a weak understanding of democratic values. Others say that voting is valuable and ought to be encouraged among everyone, no matter how politically aware voters are. Some argue that participation is the best teacher of democratic values, and that those who do not participate feel a sense of exclusion or alienation from political life. In some countries, such as Australia, Argentina, Belgium and Greece, voting is mandatory for most citizens.
One consequence of declining turnout is that political parties need the support of a smaller slice of the population to win high office. In the 2011 federal election, for example, the Conservative Party won a majority government (more than half the seats in the House of Commons) with less than 40 per cent (5.8-million votes) of the total votes cast (14.8-million). However, more than 9 million Canadians did not turn out to vote. If the total eligible electorate of 24.3 million is considered, the winning majority was achieved with the support of fewer than 25 per cent of all eligible voters. This phenomenon is perfectly constitutional; but it raises questions about the legitimacy of Canada’s democracy, and that of the governments elected by it.

Voter Turnout for Federal Elections and Referendums |
||||
|
Date of election/ |
Population |
Number of |
Total |
Voter turnout (%) |
|
7 August - 20 September 1867 |
3,230,000 |
361,028 |
268,387 |
73.1 |
|
20 July - 12 October 1872 |
3,689,000 |
426,974 |
318,329 |
70.3 |
|
22 January 1874 |
3,689,000 |
432,410 |
324,006 |
69.6 |
|
17 September 1878 |
3,689,000 |
715,279 |
534,029 |
69.1 |
|
20 June 1882 |
4,325,000 |
663,873 |
508,496 |
70.3 |
|
22 February 1887 |
4,325,000 |
948,222 |
724,517 |
70.1 |
|
5 March 1891 |
4,833,000 |
1,113,140 |
778,495 |
64.4 |
|
23 June 1896 |
4,833,000 |
1,358,328 |
912,992 |
62.9 |
|
29 September 1898 (ref.) |
4,833,000 |
1,236,419 |
551,405 |
44.6 |
|
7 November 1900 |
4,833,000 |
1,167,402 |
958,497 |
77.4 |
|
3 November 1904 |
5,371,000 |
1,385,440 |
1,036,878 |
71.6 |
|
26 October 1908 |
5,371,000 |
1,463,591 |
1,180,820 |
70.3 |
|
21 September 1911 |
7,204,527 |
1,820,742 |
1,314,953 |
70.2 |
|
17 December 1917 |
7,591,971 |
2,093,799 |
1,892,741 |
75.0 |
|
6 December 1921 |
8,760,211 |
4,435,310 |
3,139,306 |
67.7 |
|
29 October 1925 |
8,776,352 |
4,608,636 |
3,168,412 |
66.4 |
|
14 September 1926 |
8,887,952 |
4,665,381 |
3,273,062 |
67.7 |
|
28 July 1930 |
8,887,952 |
5,153,971 |
3,922,481 |
73.5 |
|
14 October 1935 |
10,367,063 |
5,918,207 |
4,452,675 |
74.2 |
|
26 March 1940 |
10,429,169 |
6,588,888 |
4,672,531 |
69.9 |
|
27 April 1942 (ref.) |
11,494,627 |
6,502,234 |
4,638,847 |
71.3 |
|
11 June 1945 |
11,494,627 |
6,952,445 |
5,305,193 |
75.3 |
|
27 June 1949 |
11,823,649 |
7,893,629 |
5,903,572 |
73.8 |
|
10 August 1953 |
14,003,704 |
8,401,691 |
5,701,963 |
67.5 |
|
10 June 1957 |
16,073,970 |
8,902,125 |
6,680,690 |
74.1 |
|
31 March 1958 |
16,073,970 |
9,131,200 |
7,357,139 |
79.4 |
|
18 June 1962 |
18,238,247 |
9,700,325 |
7,772,656 |
79.0 |
|
8 April 1963 |
18,238,247 |
9,910,757 |
7,958,636 |
79.2 |
|
8 November 1965 |
18,238,247 |
10,274,904 |
7,796,728 |
74.8 |
|
25 June 1968 |
20,014,880 |
10,860,888 |
8,217,916 |
75.7 |
|
30 October 1972 |
21,568,311 |
13,000,778 |
9,974,661 |
76.7 |
|
8 July 1974 |
21,568,311 |
13,620,353 |
9,671,002 |
71.0 |
|
22 May 1979 |
22,992,604 |
15,233,653 |
11,541,000 |
75.7 |
|
18 February 1980 |
22,992,604 |
15,890,416 |
11,015,514 |
69.3 |
|
4 September 1984 |
24,343,181 |
16,774,941 |
12,638,424 |
75.3 |
|
21 November 1988 |
25,309,331 |
17,639,001 |
13,281,191 |
75.3 |
|
26 October 1992 (ref.) |
20,400,896 |
13,725,966 |
9,855,978 |
71.8 |
|
25 October 1993 |
27,296,859 |
19,906,796 |
13,863,135 |
69.6 |
|
2 June 1997 |
27,296,859 |
19,663,478 |
13,174,698 |
67.0 |
|
27 November 2000 |
28,846,761 |
21,243,473 |
12,997,185 |
61.2 |
|
28 June 2004 |
30,007,094 |
22,466,621 |
13,683,570 |
60.9 |
|
23 January 2006 |
30,007,094 |
23,054,615 |
14,908,703 |
64.7 |
|
14 October 2008 |
31,612,897 |
23,677,639 |
13,929,093 |
58.8 |
|
2 May 2011 |
33,476,688 |
24,257,592 |
14,823,408 |
61.1 |
|
19 October 2015 |
33,476,688 |
25,939,742 |
17,711,983 |
68.3 |
|
21 October 2019 |
35,151,728 |
27,373,058 |
18,350,359 |
67.0 |
(courtesy Elections Canada)
How to Encourage Turnout
Attempts to increase participation should focus on increasing the benefits or reducing the costs of political action; or on increasing the rate of personal contact between parties and voters. On the benefit side, the sense that individual votes mean little in ridings dominated heavily by one party could be averted by a shift to an electoral system of proportional representation. In that system, parties are awarded parliamentary seats based on their total vote percentage. Proportional representation — or some combination of it and the current first-past-the-post electoral system — might encourage greater turnout. (See also Electoral Reform.)
On the cost side, easy access to advance polls and to special ballots may increase turnout. But the evidence of this is scant. Scheduling elections on weekends would probably help. Increasing tax credits for contributors to parties or candidates could also boost political participation, if not actual voter turnout.
Surveys show that citizens are more likely to vote when they are asked to; particularly if they are contacted face-to-face, and especially if they are offered a ride to the polling station or reminded where their polling station is located.
Role of Political Parties
The principal agents for encouraging and facilitating political participation must be political parties themselves. According to survey evidence, many more citizens are willing to work in campaigns than are asked. Parties have substituted investment in television advertising, online outreach and digital messaging for the labour of actual volunteers. This has contributed to turnout decline. The renewed interest in get-out-the-vote (GOTV) strategies — which involve everything from phoning known party supporters, to providing transport to polling stations — may help. However, they may also lead to even more focus on parties’ bases.
See also Canadian Party System; Canadian Electoral System; Chief Electoral Officer; Political Party Financing in Canada; Political Campaign; Electoral Behaviour.