How is GDP Measured and Constructed?
GDP is measured from the circular flow of income and expenditure between households, firms and government in an economy. National income accounting provides two basic approaches to constructing GDP, the expenditure approach and the income approach.
The expenditure approach measures the flow of total spending on final goods and services in the economy and adds up its components. These components are: consumer spending on goods and services; investment spending (spending on capital assets like machinery or housing by business and government and any changes in inventories); government spending on goods and services (excluding transfer payments such as welfare or debt service costs); and net exports (exports of goods and services minus imports from abroad; see Balance of Payments).
The income approach estimates GDP by measuring the value of all the incomes that are generated in producing goods and services. Its principal components are the wages, salaries and other compensation of employees; the gross operating surpluses of corporations; gross mixed income (remuneration for work carried out by unincorporated business owners); taxes less subsidies on production (e.g., property taxes, payroll taxes, training subsidies); and taxes less subsidies on products and imports (e.g., GST, rail passenger subsidies, payments to farmers).
The slight difference between GDP calculated by either the expenditure or the income approach is reconciled through the addition or subtraction of a statistical discrepancy, which is half the difference between the expenditure and income approaches.
GDP in 2016 via Expenditure Approach
| Millions of dollars | Percent of GDP | |
| Consumption | 1,182,155 | 58.3 |
| Durable goods | 148,723 | - |
| Semi-durable goods | 82,507 | |
| Non-durable goods | 273,422 | |
| Services | 648,871 | |
| Other | 28,632 | |
| Investments | 384,644 | 19 |
| Residential structures | 154,045 | - |
| Non-residential structure, machinery and equipment | 197,274 | |
| Inventories | -2,314 | |
| Other | 35,639 | |
| Government | 508,662 | 25.1 |
| Goods and services | 429,811 | - |
| Investment | 78,851 | |
| Net exports | -48,048 | -2.4 |
| Exports of goods and services | 628,695 | - |
| Imports of goods and services | 676,743 | |
| Statistical discrepancy | -428 | |
| Total GDP | 2,027,544 | 100 |
|
Source: Statistics Canada, CANSIM table 380-0064
|
||
GDP in 2016 via Income Approach
| Millions of dollars | Percent of GDP | |
| Compensation of employees | 1,050,522 | 51.8 |
| Gross operating surplus | 508,469 | 25.1 |
| Gross mixed income | 241,768 | 11.9 |
| Taxes less subsidies on products and imports | 137,309 | 6.8 |
| Taxes less subsidies on production | 89,048 | 4.4 |
| Statistical discrepancy | 428 | |
| Total GDP | 2,027,544 | 100 |
| Source: Statistics Canada, CANSIM table 380-0063 | ||
GDP as an Economic Indicator: Pros and Cons
GDP is a widely accepted international measure of economic performance as it provides a concise number that attempts to capture the market value of economic activity at a point in time. It facilitates comparisons both at a point in time and over time. It provides a readily understood and consistent tool to measure economic output — the value of goods and services produced — and to guide economic policy (see Fiscal Policy). While boosting the growth rate of GDP is an important policy goal, using GDP as an overall measure of economic performance has a number of disadvantages.
First, it only counts activities that have a market price and as a result it omits the value of any unpaid activities such as housework, do-it-yourself or volunteer activity. It has been estimated that in Canada the value of unpaid housework alone equals an estimated 32 to 39 per cent of GDP. In addition, any illegal or black market economic activities are also not included (see Underground Economy). As a result, GDP does not represent the total amount of economic activity in an economy.
Second, it has the perverse characteristic that if a disaster (either natural or human induced) or war occurs, the subsequent recovery or rebuilding efforts actually raise GDP even though in many respects a society is worse off. Environmental damage from economic activity is not captured by traditional GDP estimates, though efforts to clean up the environment such as after an oil spill are. Attempts have been made to include the environment in GDP estimates by estimating so-called green GDP estimates, which try to value non-market traded resources such as the pleasures of green space and environmental damages from pollution.
Third, as a measure of welfare, the increased output of goods and services does not fully measure the welfare or well-being of the members of a society (see Standard of Living). GDP does not capture differences in the distribution of output and income between rich and poor (see Income Distribution) and it does not capture changes in the quality over time of the goods produced.
Evolution and Composition of Canadian GDP: 1870 to 2016
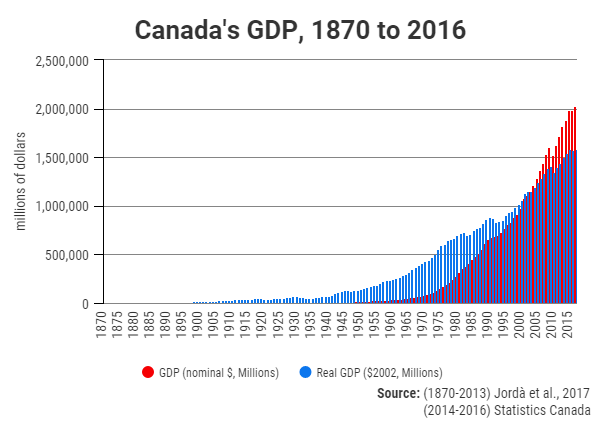
Canada’s total nominal GDP in 1870 has been estimated at $383 million in current dollars and has grown to reach $2.03 trillion by 2016. Nominal GDP is not adjusted for inflation and therefore increases in value may simply reflect price changes rather than quantity changes. Adjusting the value of output for inflation using the consumer price index (2002=100), real GDP in 2002 dollars grew from $7.929 billion in 1870 and reached $1.579 trillion by 2016. Figure 1 plots both nominal and real GDP from 1870 to 2016 and illustrates the expansion of the Canadian economy over time.
Figure 1
Figure 2 divides real GDP by Canada’s population and presents real per capita GDP from 1870 to 2016. In 1870, real per capita GDP in 2002 dollars was $2,097 and grew over time to reach $43,526 in 2016. The average annual growth rate of real GDP from 1870 to 2016 was 2.2 per cent. Given this growth rate, the average per capita income of Canadians has doubled approximately every 33 years. As Figure 2 illustrates, there have been periods where real per capita GDP has declined. For example, the years 1929 to 1933 of the Great Depression saw real per capita GDP decline by approximately 30 per cent.
Figure 2
GDP has also been constructed so as to provide estimates of the value of output of specific sectors of the economy. Figure 3 shows that in 1870, Canada had more of an agricultural economy and that nearly 40 per cent of its GDP came from agriculture. Manufacturing was the next largest sector and accounted for 21 per cent of GDP (see Industrialization in Canada). The productions of goods, rather than services, marked the Canadian economy at that point in history.
Figure 3
Along with rising GDP over time, Canada’s economy has also seen a shift in the composition of output away from goods and towards service production. Figure 4 illustrates that by 2016, Canada’s economy had become much more diversified, with services in finance, insurance and real estate, business management, professional and technical services, public administration, accommodation and food services, health care and social assistance, education, information, arts, entertainment and culture, and retail and wholesale trade accounting for some 65 per cent of GDP. Agriculture and manufacturing account for just over 10 per cent of output.
Figure 4

 Share on Facebook
 Share on X
 Share by Email
 Share on Google Classroom

